APAC go-to-market intelligence · free data release
Where to go next in Asia: 22 markets, scored for go-to-market
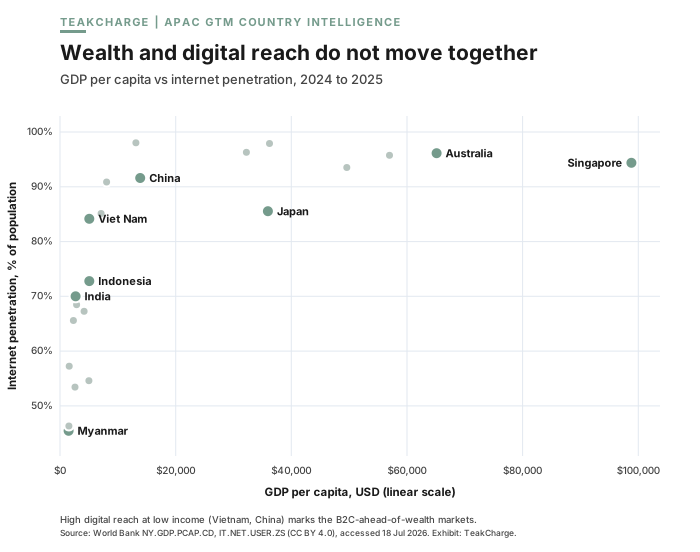
The biggest APAC markets are not the readiest. This scorecard ranks 22 Asia-Pacific economies on B2B market readiness, B2C digital adoption, and investment attractiveness, all of it built on public data: the World Bank, the International Telecommunication Union, the World Intellectual Property Organization's innovation index, and national tax authorities. Every market is scored the same way, so the charts read against each other, not one at a time.
Comment and copy enabled.
Three things this data says, before you download anything
1. Where a tax system starts to treat someone as rich
Across the 20 markets that publish a dollar threshold, the top personal rate begins between 0.45 times local income per head in Hong Kong and 60.7 times in Indonesia. Same region, same question, and about 135 times the difference in the answer.
| Market | Income per head (USD) | Top rate starts at (USD) | Multiple |
|---|---|---|---|
| Hong Kong | 56,983 | 25,600 | 0.45x |
| Sri Lanka | 5,002 | 8,300 | 1.66x |
| Australia | 65,130 | 125,000 | 1.92x |
| New Zealand | 49,591 | 108,400 | 2.19x |
| Mongolia | 7,108 | 52,200 | 7.34x |
| Japan | 35,951 | 267,000 | 7.43x |
| Singapore | 98,814 | 775,000 | 7.84x |
| Vietnam | 5,066 | 47,100 | 9.30x |
| China | 13,862 | 134,000 | 9.67x |
| India | 2,702 | 27,900 | 10.32x |
| Bangladesh | 2,597 | 29,500 | 11.36x |
| Cambodia | 2,872 | 36,600 | 12.74x |
| Laos | 2,325 | 35,800 | 15.40x |
| Pakistan | 1,596 | 25,000 | 15.67x |
| Thailand | 8,057 | 149,000 | 18.49x |
| South Korea | 36,227 | 725,000 | 20.01x |
| Nepal | 1,536 | 36,200 | 23.57x |
| Philippines | 4,171 | 139,000 | 33.33x |
| Malaysia | 13,125 | 471,000 | 35.89x |
| Indonesia | 5,060 | 307,000 | 60.68x |
Brunei and Myanmar publish no dollar threshold in this file and are left out rather than estimated. This is a fact about each tax system, not a wealth map, and it is not an effective tax rate. Most dollar figures carry no stated conversion date; only one row states both a rate and a date. Source: TeakCharge APAC dataset, Tax and Economy tabs, compiled 5 August 2026. The subscriber workbook that runs this on your own price is issued through APAC Signal.
2. Two neighbours, and why the average lies
Thailand and Malaysia get treated as one decision. Malaysia is richer per head and half the size; Thailand is much larger online. At a USD 400 price the two ranges still overlap at the bottom, and separate at the top. The difference is not one number. It is two different shapes.
| Measure | Thailand | Malaysia |
|---|---|---|
| People | 71.6 million | 36.0 million |
| Urban residents | 45.0 million | 27.8 million |
| Internet users | 65.1 million | 35.3 million |
| Adults with an account | 65.7 million | 31.9 million |
| Income per head | USD 8,057 | USD 13,125 |
| GDP growth | 2.4% | 5.2% |
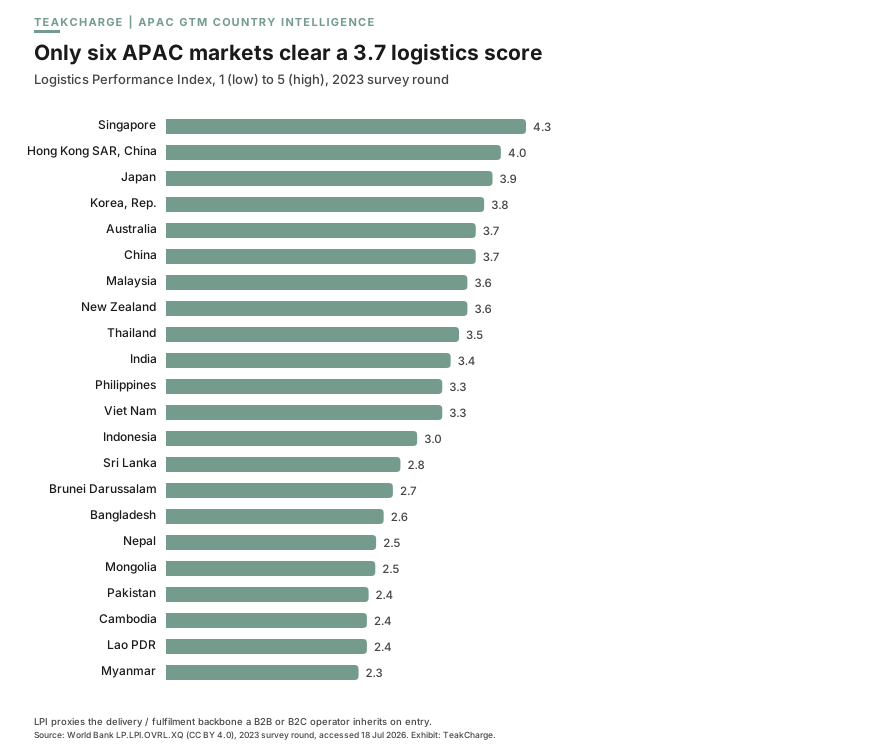
| Logistics Performance Index / regulatory quality | 3.5 / 56.5 | 3.6 / 65.6 |
| Must-have payment rail | PromptPay | DuitNow |
| Consumption tax | 7% VAT, a temporary reduction in force to 30 Sep 2026 | No VAT. Sales tax 5-10%, service tax 6-8% |
| Top personal rate starts at | USD 149,000 (18.5x income per head) | USD 471,000 (35.9x income per head) |
| Affordability range at USD 400, 2% planning rule | 3.6 to 7.2 million, middle reading 4.4 million | 3.6 to 10.8 million, middle reading 8.4 million |
The affordability figures are an estimated range from published income shares and a 2% planning rule, not a count of buyers. Singapore, the usual third comparison, publishes no income shares in this file and is left blank rather than filled. Source: TeakCharge APAC dataset, compiled 5 August 2026; payment rails from the 18 August 2026 channel read. The subscriber workbook that runs this on your own price is issued through APAC Signal.
3. The door you actually sell through
Shopee is still the first door across Indonesia, Malaysia, the Philippines, Singapore, Thailand and Vietnam. Lazada is the other incumbent. TikTok Shop is the name sellers talk about as it grows.
Cash on delivery is not a payment preference, it is a planning cost. In the Philippines, Indonesia and Vietnam a failed cash-on-delivery parcel is the unit gone plus freight both ways, and those parcels fail at roughly three times the prepaid rate. In Singapore it is not a cost at all. In Malaysia and Thailand it is fading.
So do not model a Singapore checkout as if it were Manila, and do not model Jakarta on a 2022 picture of who the marketplace leader was.
Names only, dated 18 August 2026, and no market shares: a share read from a report is out of date the week you quote it. The failure-rate comparison is a published industry estimate, not a measurement of your own parcels. The subscriber workbook that runs this on your own price is issued through APAC Signal.
The workbook behind these three
The free dataset on this page is the evidence: 22 markets, 117 measures, every source named. The subscriber workbook is the working file on top of it. You set a price and a set of weights. It ranks what survives, prints a range of people who could plausibly afford that price where a published income distribution exists, and leaves five markets blank rather than guess.
It will not tell you how many customers you will have. It will not clear a regulator. It will show you which markets to look at first on your own numbers, the tax picture in each, and the named door to knock on. It goes to subscribers as a beta, and it says where it is uncertain.
As of the Version 2 sheet on this page
- 22 markets, 117 measures, three composites scaled 0 to 100 inside this field only.
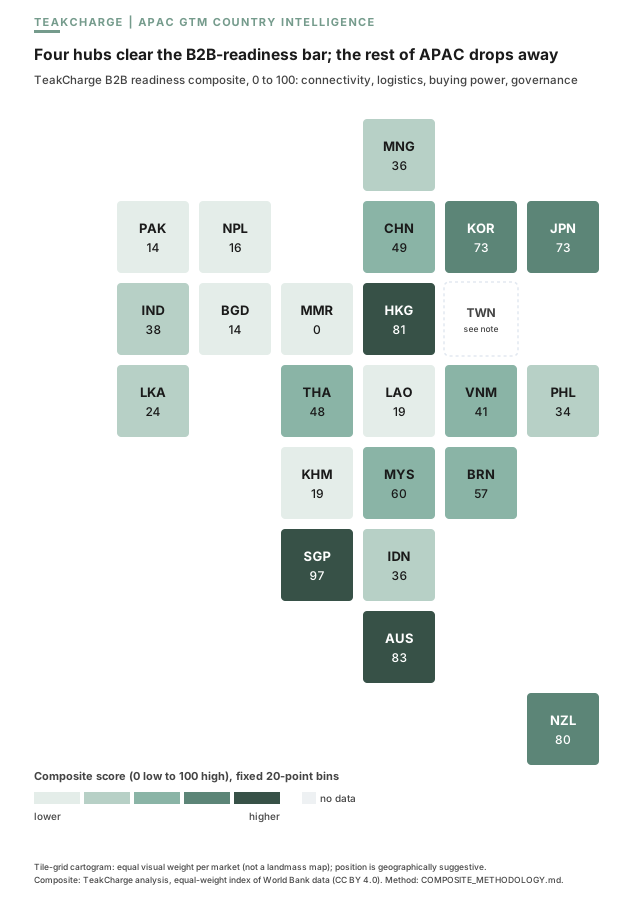
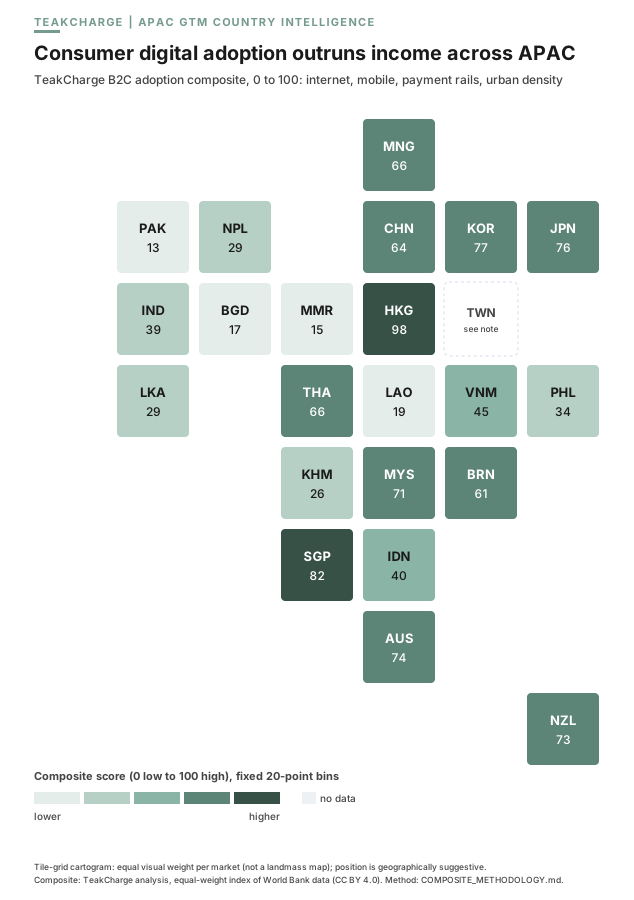
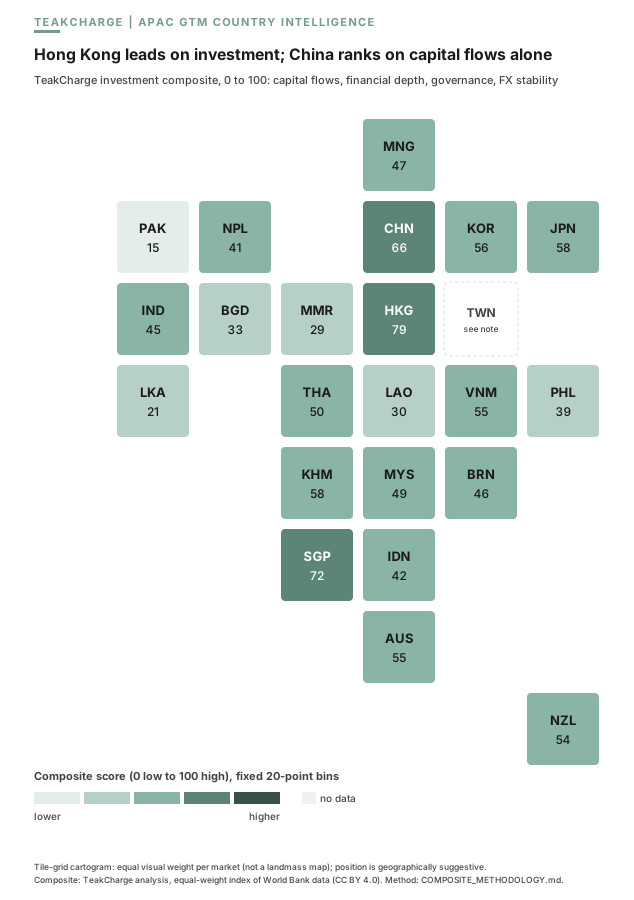
- Singapore leads B2B market readiness at 97. Hong Kong leads B2C digital adoption at 98 and investment attractiveness at 79.
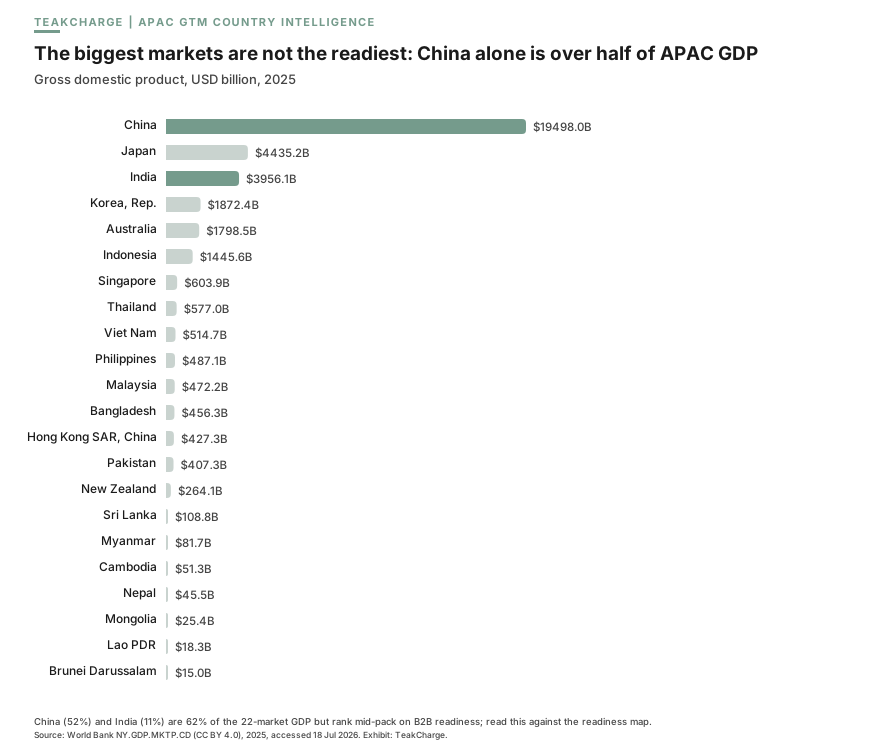
- China and India lead on size and sit mid-pack on readiness.
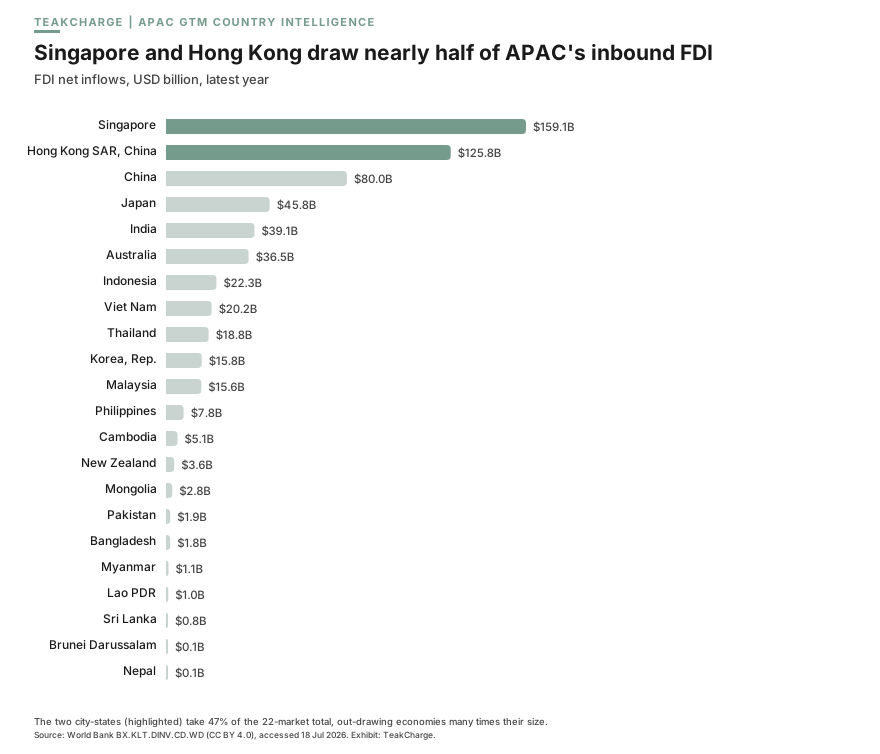
- Singapore and Hong Kong draw about 47% of the region's inbound FDI.
- A missing figure stays blank. Nothing is filled from an average.
- Add or remove a market and the field rescales. This is an indicative comparison, not a stable ranking.
Definitions
- B2B market readiness: the composite of public series on the business environment, logistics and related inputs named in the sheet.
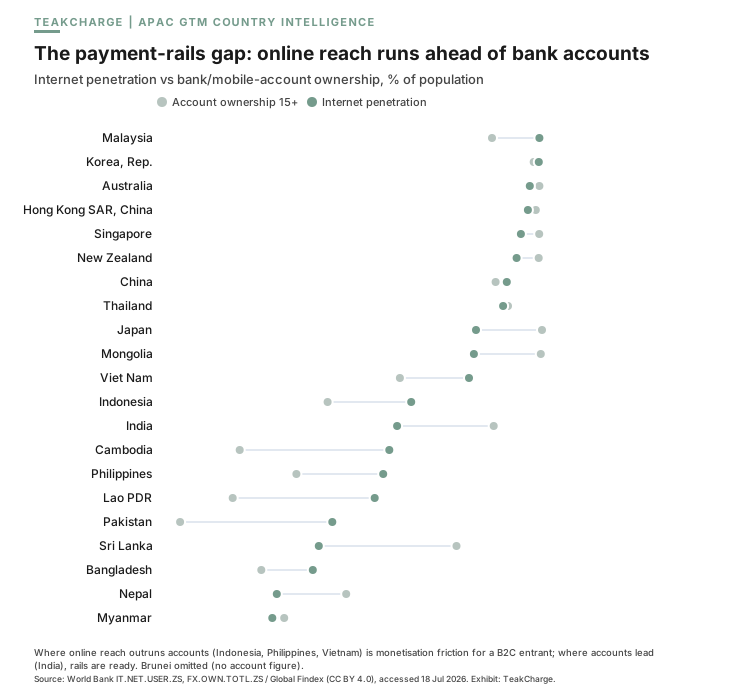
- B2C digital adoption: public series on internet reach, account access and related digital-use measures, named in the sheet.
- Investment attractiveness: public series on capital, tax and related investment conditions, named in the sheet.
- Scaled 0 to 100 inside this set of 22: a score is a position in this field, not a universal grade. A different set of markets would move the numbers.
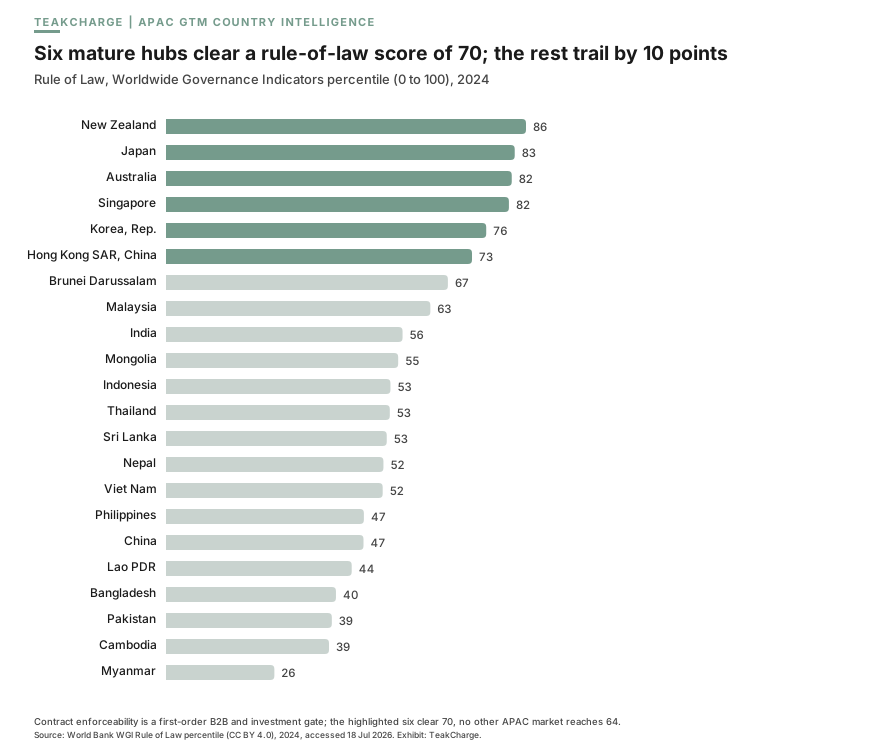
See all nine exhibits
Download the dataset
One file, no sign-up:
- APAC Go-to-Market Intelligence, Version 2 (Google Sheets), the full working dataset: 22 markets and 117 measures across economy, digital and connectivity, business environment, investment and finance, 78 innovation indicators, and tax, plus a measure dictionary, the reference year behind every figure, a named gap list, and a machine-readable table. Open it, then File, Make a copy for your own editable version, or File, Download, Microsoft Excel if you want a file.
Free to use with attribution, terms below.
APAC Signal carries the twice-yearly refresh and the weekday briefing behind it. Subscribing is optional.
What sits next to this dataset: Market entry for Asia Pacific is the engagement that uses it, and Singapore grants that sit next to a market-entry plan is the funding map for a Singapore-based entrant. The other free tool here is the household net worth projection calculator.
GTM Plus: the workbook that runs your numbers
This page scores the region the same way for every reader. APAC Signal subscribers get the working version, GTM Plus: an Asia Pacific market entry workbook where you set your price and your weights, and the 22 markets rank themselves against your product. It turns published income distributions into a range of people who could plausibly pay your price, carries the full tax table with royalty withholding for every market, names the marketplaces, payment rails and regulator doors market by market, and stress tests your shortlist until it either holds or names the point where it flips.
It ships free to subscribers as a beta. Subscribe to APAC Signal and the welcome email tells you where it lives.
The three composites, one table
The scores behind the maps above, in machine-readable form. Each composite runs 0 to 100, scaled within this 22-market set; the full 117 underlying measures and every reference year are in the dataset download. The sage figure marks each column's leader.
| Market | Code | B2B market readiness | B2C digital adoption | Investment attractiveness |
|---|---|---|---|---|
| Singapore | SGP | 97 | 82 | 72 |
| Australia | AUS | 83 | 74 | 55 |
| Hong Kong | HKG | 81 | 98 | 79 |
| New Zealand | NZL | 80 | 73 | 54 |
| Japan | JPN | 73 | 76 | 58 |
| South Korea | KOR | 73 | 77 | 56 |
| Malaysia | MYS | 60 | 71 | 49 |
| Brunei | BRN | 57 | 61 | 46 |
| China | CHN | 49 | 64 | 66 |
| Thailand | THA | 48 | 66 | 50 |
| Vietnam | VNM | 41 | 45 | 55 |
| India | IND | 38 | 39 | 45 |
| Indonesia | IDN | 36 | 40 | 42 |
| Mongolia | MNG | 36 | 66 | 47 |
| Philippines | PHL | 34 | 34 | 39 |
| Sri Lanka | LKA | 24 | 29 | 21 |
| Cambodia | KHM | 19 | 26 | 58 |
| Laos | LAO | 19 | 19 | 30 |
| Nepal | NPL | 16 | 29 | 41 |
| Bangladesh | BGD | 14 | 17 | 33 |
| Pakistan | PAK | 14 | 13 | 15 |
| Myanmar | MMR | 0 | 15 | 29 |
Source: World Bank Open Data (CC BY 4.0), ITU, WIPO Global Innovation Index, national tax authorities. Composite analysis: TeakCharge. Free to use with attribution, terms below.
How the composites are built
Equal weights, on purpose. Each lens in the exhibits above averages the source series named in the sheet, scaled across the 22 economies. The sheet itself carries the raw figures, not the scores: copy it and slice it however your question demands.
Construction rules:
- Every figure carries its reference year; the statistical range runs 2012 to 2025, and each tax row states its own tax year, including 2026 and 2027 positions.
- A missing figure stays blank and is named in the gap list. Nothing is filled in from an average or carried over from another market.
- Anything with no clean redistributable source, deal counts and corporate tax among them, is named in the sheet and left out rather than filled from a restricted source.
- The full construction and every source sit in the sheet's Sources and Methodology tab.
Read the order as indicative, not precise. Where the method is weakest:
- Every score is scaled against the strongest and weakest performer in this group of 22. One runaway leader compresses the rest, and a different set of markets would shift the positions even where a market's own numbers had not moved.
- Where a market is missing a component, its score rests on fewer inputs, so the markets with the thinnest data carry the least firm positions.
- A single score can blend figures published years apart, so it is a latest-available read rather than a snapshot of one moment.
Use it to shortlist and to argue, not to separate two markets sitting a place apart. Copy the sheet and test how much any ordering actually holds against your own priorities.
Want the weights set for your sector, or a second read on your two priority markets? Start a conversation.
Licence and attribution
Download, share, quote, and republish, including commercially, under the source data's own licence, provided you keep the attribution. Use either form:
- Short form (chart caption or slide): Source: World Bank Open Data (CC BY 4.0). Composite analysis and exhibit: TeakCharge.
- Full form (page or report): APAC Go-to-Market Country Intelligence by TeakCharge, https://teakcharge.com. Underlying data: World Bank Open Data (World Development Indicators, Worldwide Governance Indicators, Global Findex), licensed CC BY 4.0. Composite indices are TeakCharge analysis. Free to use with attribution.
The World Bank does not endorse TeakCharge or this analysis. The composite indices are an equal-weight default, not a claim that every factor matters equally to every entrant. Figures carry the reference-year lag of their source. This is market intelligence, not investment advice.